

Business · Markets · 11 hrs ago
A 150-year-old chart cannot reliably predict stock market moves
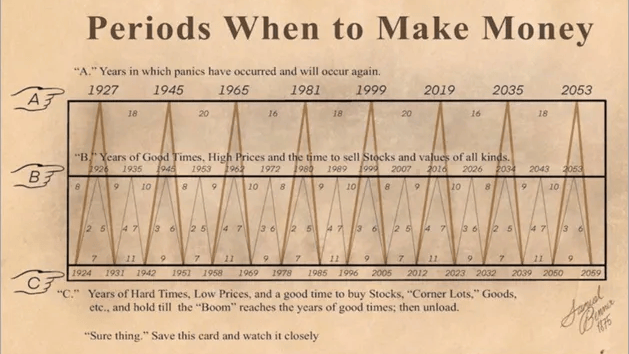
A chart called “Periods when to make Money,” created in the 1870s, is circulating online as a guide to when investors should buy or sell.
It appears to have pointed to selling before downturns in 1929, 2000, 2008 and 2020, and it advises selling assets in 2026.
The chart’s origins are unclear, though accounts link it to predictions about crop prices and to astrology.
Andreas Hackethal, a finance professor at the Leibniz Institute for Financial Research SAFE in Frankfurt, says the chart has no sound economic basis.
He says its apparent accuracy can be explained by chance: many predictions were made, and the ones that failed have been forgotten.
Financial markets do move in cycles, but technology, supply and demand, and other complex forces shape them, so simple patterns cannot reliably forecast long-term prices.
The chart’s 2026 warning is therefore not a reliable reason on its own to sell investments.

A 150-year-old chart circulating online cannot reliably predict stock market movements, according to finance professor Andreas Hackethal.
The chart, called “Periods when to make Money,” uses astrological ideas rather than economic analysis.
It has attracted attention for apparently recommending sales before several market crises.
The chart also advises selling assets in 2026.
Hackethal says its apparent accuracy may be due to chance and that past hits do not mean it will be right in the future.
- Who
- Investors and financial bloggers discuss the chart; Andreas Hackethal, a finance professor, assesses it.
- What
- A chart from the 1870s claims to identify periods for buying or selling assets, but Hackethal says it cannot reliably predict markets.
- When
- The chart dates to the 1870s and recommends selling in 2026.
- Where
- The chart circulates online and on social media, blogs and YouTube.
- Why
- Its apparent accuracy has drawn attention, but Hackethal says the chart relies on astrology and its past hits may be chance.
Chart's proponents
Andreas Hackethal
Past accuracy
Chart's proponents
Some financial bloggers say the chart has been 90 percent accurate and point to recommendations before market crises.
Andreas Hackethal
Hackethal says the apparent accuracy can be explained by chance and that failed predictions are forgotten.
Usefulness for 2026
Chart's proponents
The chart recommends selling assets in 2026.
Andreas Hackethal
Hackethal says past apparent successes do not mean it will be right in the future.
The chart known as “Periods when to make Money” was created.
The chart recommended selling securities before the 1929 crash.
The chart recommended selling securities before the dot-com bubble burst.
The chart recommended selling securities before the 2008 financial crisis.
The chart recommended selling securities before the coronavirus shock.
The chart recommends that investors sell their assets.
- Chart name
- Periods when to make Money
- Chart origin
- 1870s
- Professor
- Andreas Hackethal, Leibniz Institute for Financial Research SAFE in Frankfurt
- Suggested sale year
- 2026
- Earlier years cited
- 1927, 1999, 2007 and 2019
What people are saying
Das hat an den Märkten nichts zu suchen.
Wenn Sie vor einhundert Jahren einhundert Leute gebeten hätten, eine Vorhersage für die Börsen zu schreiben, ist die Wahrscheinlichkeit groß, dass eine davon relativ akkurat gewesen wäre.
Sources
Related news

Frank Rosin helps former Heilbronn restaurateurs with €100,000 debt

Volkswagen vehicle deliveries fall 14.3% in the third quarter

Deutsche Bank chief urges Germany to speed up reforms

German postage could rise by 20.35% from 2027

Airbus tests Valkyrie combat drone in Sweden at nearly 1,000 km/h

Ryanair plans to leave Bremen Airport from summer 2027 but leaves door open

Ryanair pulls back in Germany as flight costs rise

Volkswagen chief calls for European support as automaker restructures

Porsche deliveries fall 16% as China sales drop and 911 grows

VW chief calls for European unity as sales fall, especially in China
Whey protein prices rise as demand outpaces supply
