1 week ago
Three Questions Challenge India’s New Manufacturing Growth Data
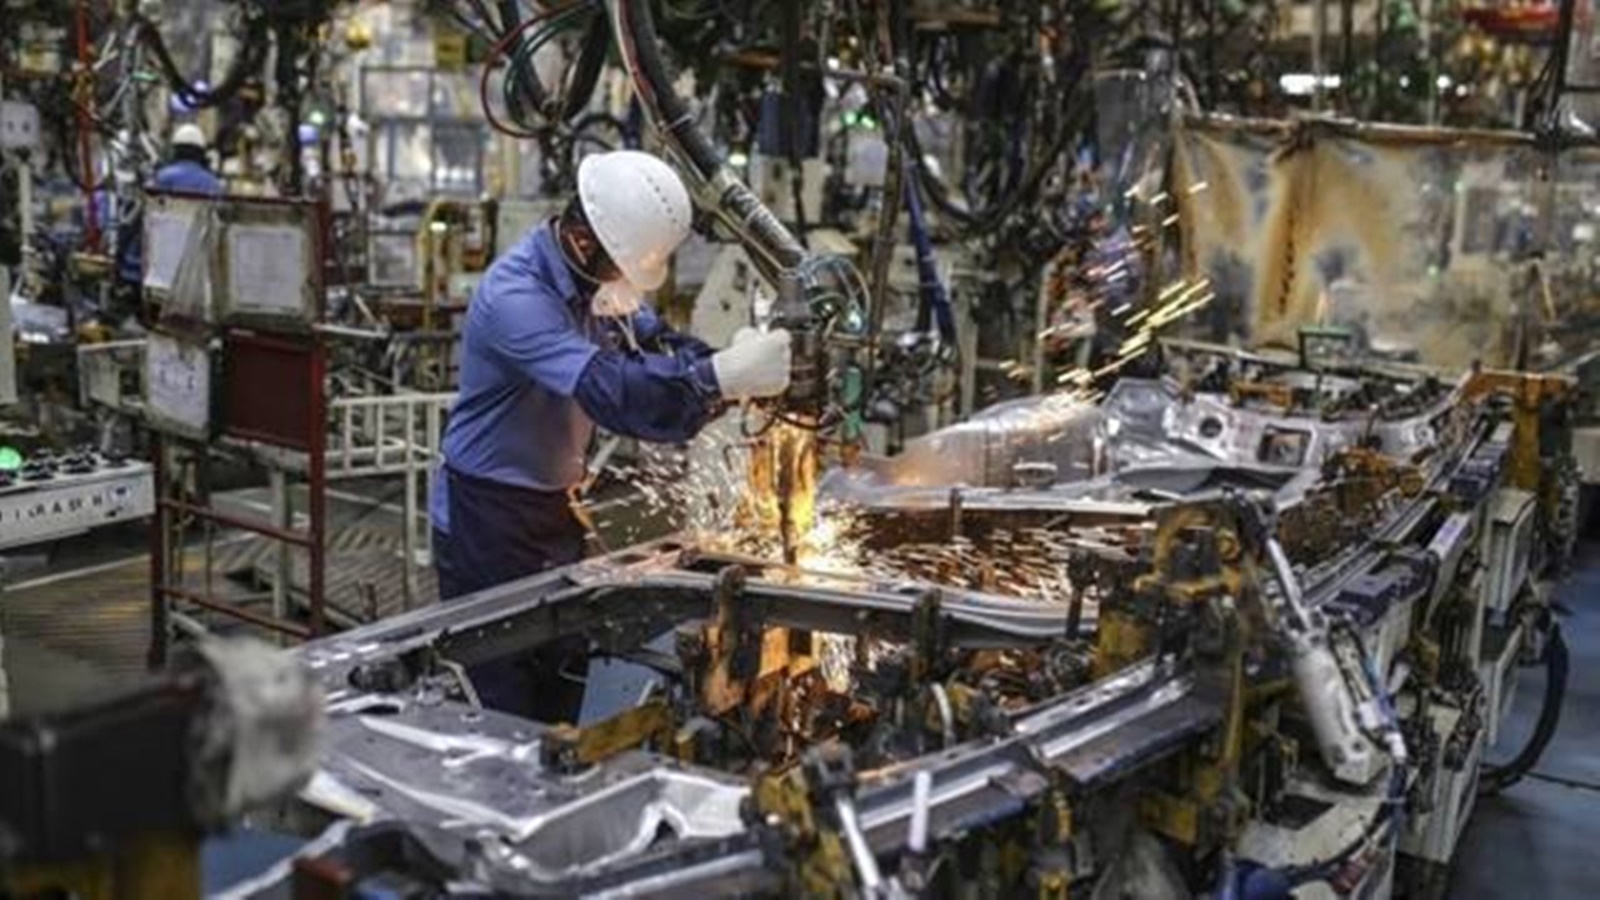
Economists are checking whether India’s new manufacturing data make sense.
They are comparing two measures: manufacturing value added and factory production.
The new data show manufacturing prices falling for nine quarters, which the authors find hard to explain.
They also show value added growing much faster than the Index of Industrial Production.
The authors say differences between formal and informal businesses do not fully explain this gap.
They note that the two measures used to move more closely together before 2011-12.
Since then, they have often moved differently, especially after September 2022.
Ministry officials say the new GDP method fixed earlier measurement problems.
The economists want clearer explanations before judging India’s manufacturing progress and government programmes.

Authors question why the manufacturing GVA deflator showed falling prices for nine straight quarters from 2023 to 2025.
Real manufacturing GVA reportedly grew about twice as fast as IIP between 2022-23 and 2025-26: 11% versus 6%.
The authors say informal-sector growth cannot fully explain the GVA-IIP gap because recent estimates use formal-sector data as a proxy.
They argue that manufacturing GVA and IIP have moved less closely together since the 2011-12 methodology changes, especially since September 2022.
The authors call for explanations of these patterns to build confidence in the new GDP series and evaluate Make in India and PLI outcomes.
- Who
- Anand, Felman and Subramanian, who analyze India’s manufacturing statistics; Ministry of Statistics and Planning Implementation officials are also discussed.
- What
- An analysis raises three questions about the manufacturing price deflator, the gap between real GVA and IIP, and their weakening correlation in India’s new GDP series.
- Where
- India.
- When
- The analysis focuses particularly on data from 2022-23 through 2025-26, including the period from 2023 to 2025 and since September 2022.
- Why
- The authors say explanations are needed to establish confidence in the new GDP figures and assess manufacturing policies, including Make in India and the production-linked incentive scheme.
Authors’ concerns
Officials’ stated position
Reliability of the new GDP series
Authors’ concerns
The authors say unusual deflator behavior and divergences from IIP require plausible explanations before confidence in the new figures can be established.
Officials’ stated position
The Chief Economic Adviser and the Ministry of Statistics and Planning Implementation secretary emphasized that the new series used a methodology intended to solve problems in the previous series.
Manufacturing price movements
Authors’ concerns
The authors question why the manufacturing GVA deflator showed falling prices for nine consecutive quarters despite no comparable deflationary signal in core consumer prices.
Officials’ stated position
The article does not provide a specific official explanation for the prolonged negative manufacturing GVA deflator.
GVA compared with IIP
Authors’ concerns
The authors argue that real GVA growing nearly twice as fast as IIP, and the two series moving differently, needs explanation; they reject informal-sector performance as a complete explanation.
Officials’ stated position
The article notes that the measures have different definitions and that GVA includes the informal sector, although it does not present an official response addressing the full divergence.
Key facts
- Manufacturing deflator
- The manufacturing GVA deflator recorded negative growth for nine consecutive quarters between 2023 and 2025, according to the analysis.
- Real GVA growth
- Average annual real manufacturing GVA growth between 2022-23 and 2025-26 was reported at about 11%.
- IIP growth
- Average annual manufacturing growth measured by the Index of Industrial Production was reported at about 6% over the same period.
- GVA-IIP gap
- In 2025-26, the level of real manufacturing GVA exceeded IIP by about 15 percentage points.
- Earlier correlation
- Manufacturing GVA and IIP had a correlation of 0.8 before the 2011-12 methodology changes.
- Policy context
- The analysis examines manufacturing ambitions linked to Make in India and the production-linked incentive scheme.
- Data documentation
- The article says the Ministry of Statistics and Planning Implementation had not yet released a detailed standard document explaining the new calculations.
Sources
Related news
Government Defends India’s 7.8% Q1 Growth Amid GDP Debate
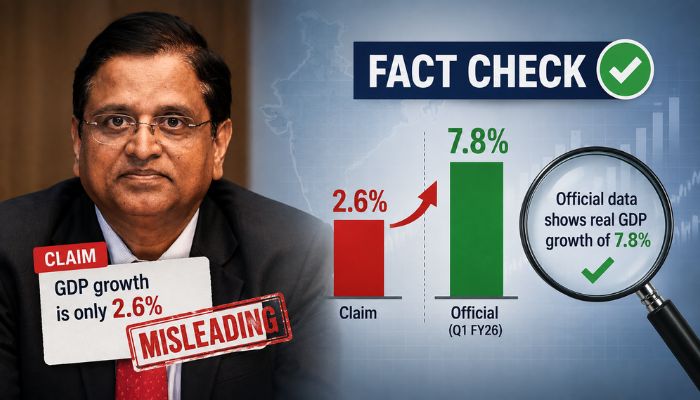
Government Rejects 2.6% Claim, Defends India’s 7.8% GDP Growth

Government Schemes Propel India’s Manufacturing Growth and Supply-Chain Rise

Modi’s Make in India Gains Face Rahul Gandhi’s Criticism

Jefferies Favors Kaynes as India Advances Electronics Component Manufacturing

Indian Chief Ministers Turn Marketers to Win Manufacturing