2 days ago
Nifty Total Market Funds Offer Broad Indian Equity Exposure

The Nifty Total Market Index follows 750 Indian companies.
It includes big, medium, small and micro-cap companies.
A fund tracking it can offer exposure to all these company sizes in one investment.
The index did better than the Nifty 50 and Nifty 500 over the periods listed in the article.
But its one-year return was still negative.
Four funds tracking the index had similar one-year results as of October 1, 2026.
These are index returns, not guaranteed returns for each fund.
Fund results can differ because of costs and tracking error.
There is not yet enough long-term history to compare the funds properly.

The Nifty Total Market Index tracks 750 stocks, including constituents of the Nifty 500 and Nifty Microcap 250.
It provides exposure to large-, mid-, small- and micro-cap stocks through a single index.
As of October 1, 2026, the index’s TRI returns were -3.14% over one year, 9.49% over three years, 9.28% over five years and 12.87% over 10 years.
The benchmark outperformed the Nifty 50 TRI and Nifty 500 TRI over the periods shown in the article.
Four listed funds had one-year returns between -3.41% and -3.71%; long-term fund-level comparisons are not yet meaningful.
- Who
- Investors considering passive exposure to Indian large-, mid-, small- and micro-cap stocks.
- What
- Nifty Total Market Index funds track a 750-stock index, with reported benchmark and fund returns.
- Where
- India.
- When
- Returns were reported as of October 1, 2026.
- Why
- The funds offer a single passive option for broad equity-market exposure instead of combining funds focused on separate market-cap segments.
Potential advantages
Limitations and cautions
Breadth of exposure
Potential advantages
One index fund can cover large-, mid-, small- and micro-cap stocks, offering a single-fund alternative to combining market-cap-specific funds.
Limitations and cautions
The index’s performance depends on how its different market-cap segments perform.
Performance evidence
Potential advantages
The Nifty Total Market TRI outperformed the Nifty 50 TRI and Nifty 500 TRI over all periods shown.
Limitations and cautions
These are benchmark returns, not necessarily the returns investors receive from a fund; fund expenses and tracking error can cause differences.
Fund track records
Potential advantages
The four schemes listed had one-year returns in a relatively narrow range.
Limitations and cautions
The funds are relatively new, so meaningful long-term fund-level comparisons are not yet available.
Key facts
- Index coverage
- 750 stocks; includes stocks in the Nifty 500 and Nifty Microcap 250.
- Nifty Total Market TRI returns
- 1 year: -3.14%; 3 years: 9.49%; 5 years: 9.28%; 10 years: 12.87%.
- Nifty 50 TRI returns
- 1 year: -8.74%; 3 years: 5.75%; 5 years: 6.29%; 10 years: 11.38%.
- Nifty 500 TRI returns
- 1 year: -3.80%; 3 years: 9.16%; 5 years: 8.89%; 10 years: 12.66%.
- Fund returns
- One-year direct-plan returns ranged from -3.41% to -3.71% as of October 1, 2026.
- Listed schemes
- Mirae Asset, Groww, Bandhan and Angel One offer Nifty Total Market Index schemes.
- Return caveat
- Index TRI returns include capital gains and dividends; fund returns can differ due to expenses and tracking error.
Sources
Related news

Flexi-Cap Funds Diverge as 31 Beat Falling Nifty 500

Active Mutual Funds Beat Nifty 500 During Two-Year Slump

India’s REITs Outperformed Nifty 50 as Market Expanded

Small-Cap Funds Lead 2026 Equity Mutual Fund Return Rankings

Expert compares large-cap mutual funds and Nifty 50 index funds
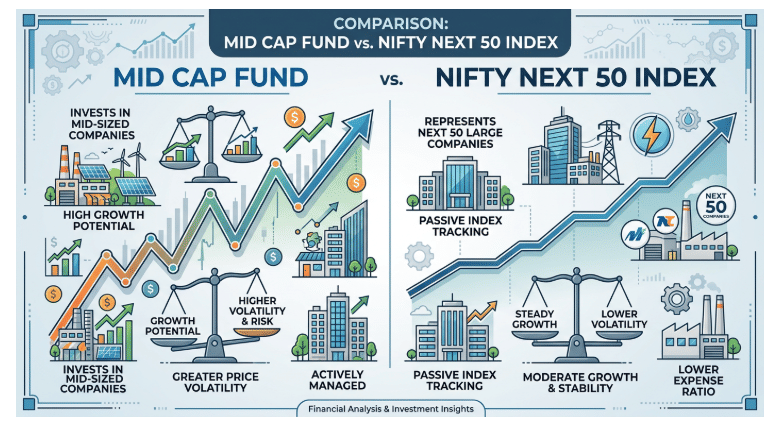
Mid Cap Funds and Nifty Next 50 Offer Different Risks

DSP Says Large-Caps Offer Better Value After Recent Divergence

DSP Ratio Suggests Nifty 50 Equal Weight Fund Strategy

BSE Replaces Wipro in Nifty 50 Index Reshuffle