1 day ago
Gold-Silver Ratio Tests Outlook Amid Fed and Iran Headwinds
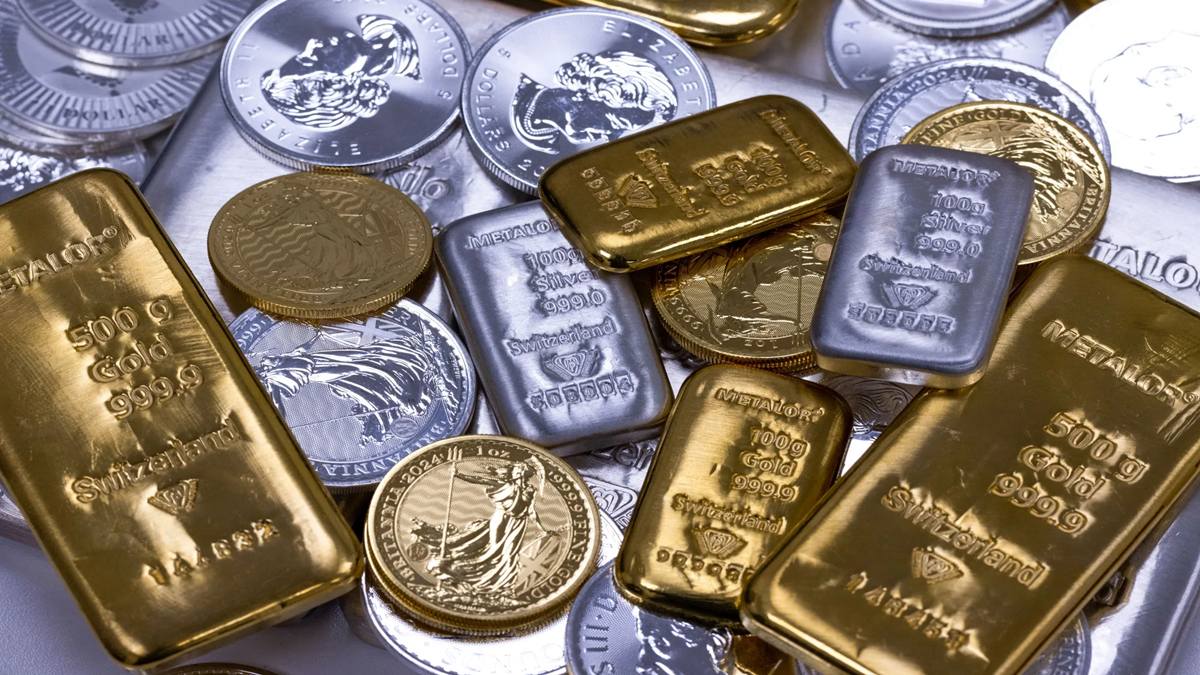
Gold and silver are valuable metals whose prices can change every day.
The gold-silver ratio shows how many ounces of silver are needed to buy one ounce of gold.
Right now, the ratio is 66, meaning 66 ounces of silver equal one ounce of gold in the comparison.
The article says this is within the usual long-term range of 60 to 70.
However, the ratio has moved much higher and lower at different points mentioned in the article.
Higher oil prices connected to the Iran conflict may increase inflation.
That could make the US Federal Reserve less likely to lower interest rates soon.
Higher interest rates can make gold and silver less attractive because they do not pay interest.
The article says investors should be cautious and consider buying gradually rather than all at once.

Gold is trading at $4,400 an ounce and silver at $66, producing a gold-silver ratio of 66.
The ratio is currently within its stated historical range of 60 to 70, although the article cites earlier readings above 100 in May 2025 and 49 by January 2026.
In India, gold is priced at Rs 1,54,494 and silver at Rs 2,35,827 on the MCX spot market.
Higher oil prices linked to the Iran conflict are raising inflation concerns and reducing expectations for near-term US Federal Reserve rate cuts.
Gold is up 3.3% in 2026 while silver is down 11%, leading the article to recommend caution and gradual buying rather than chasing sharp rallies.
- Who
- Gold and silver investors, the US Federal Reserve, central banks, and market participants are involved.
- What
- Gold and silver are facing short-term uncertainty while their price relationship, measured by the gold-silver ratio, remains under focus.
- Where
- The prices discussed are global dollar prices and Indian MCX spot-market prices.
- When
- The comparison is presented for 2026, with prices cited as of September 4, 2026; the article also discusses developments since 2025.
- Why
- Higher oil prices, inflation concerns, possible US interest-rate increases, Treasury yields, the Iran conflict, and uncertainty over Federal Reserve policy are influencing the metals.
Build Positions Gradually
Wait for More Clarity
Investment timing
Build Positions Gradually
Long-term investors may begin building positions gradually because the ratio has historically returned toward its range over time.
Wait for More Clarity
Investors may wait because inflation, interest-rate policy, oil prices, Treasury yields, and the Iran conflict could trigger sharp corrections.
Near-term price direction
Build Positions Gradually
A pause at the September FOMC meeting could support both metals, and silver may eventually catch up when precious metals rally.
Wait for More Clarity
A hawkish Federal Reserve stance, delayed rate cuts, or a possible rate increase could pressure both metals because they do not pay yield.
Key facts
- Gold price
- $4,400 per ounce
- Silver price
- $66 per ounce
- Gold-silver ratio
- 66 currently; the stated historical range is 60 to 70
- Indian gold price
- Rs 1,54,494 on the MCX spot market
- Indian silver price
- Rs 2,35,827 on the MCX spot market
- 2026 performance
- Gold is up 3.3%, while silver is down 11%
- US rate expectations
- Markets were pricing in over a 60% chance of a 25-basis-point federal-funds-rate increase that month
Sources
Related news

Gold, Silver Volatile Amid Middle East Tensions and US Data

Gold and Silver Outlook After Jackson Hole Shock

Gold and Silver Surge in Delhi Amid US-Iran Tensions

US Midterms Could Reshape Trump's Agenda Amid Economic Discontent

US Shares Video of Strikes on Three Iranian Oil Tankers

Iran and US Trade Vessel Strikes Around Strait Hormuz
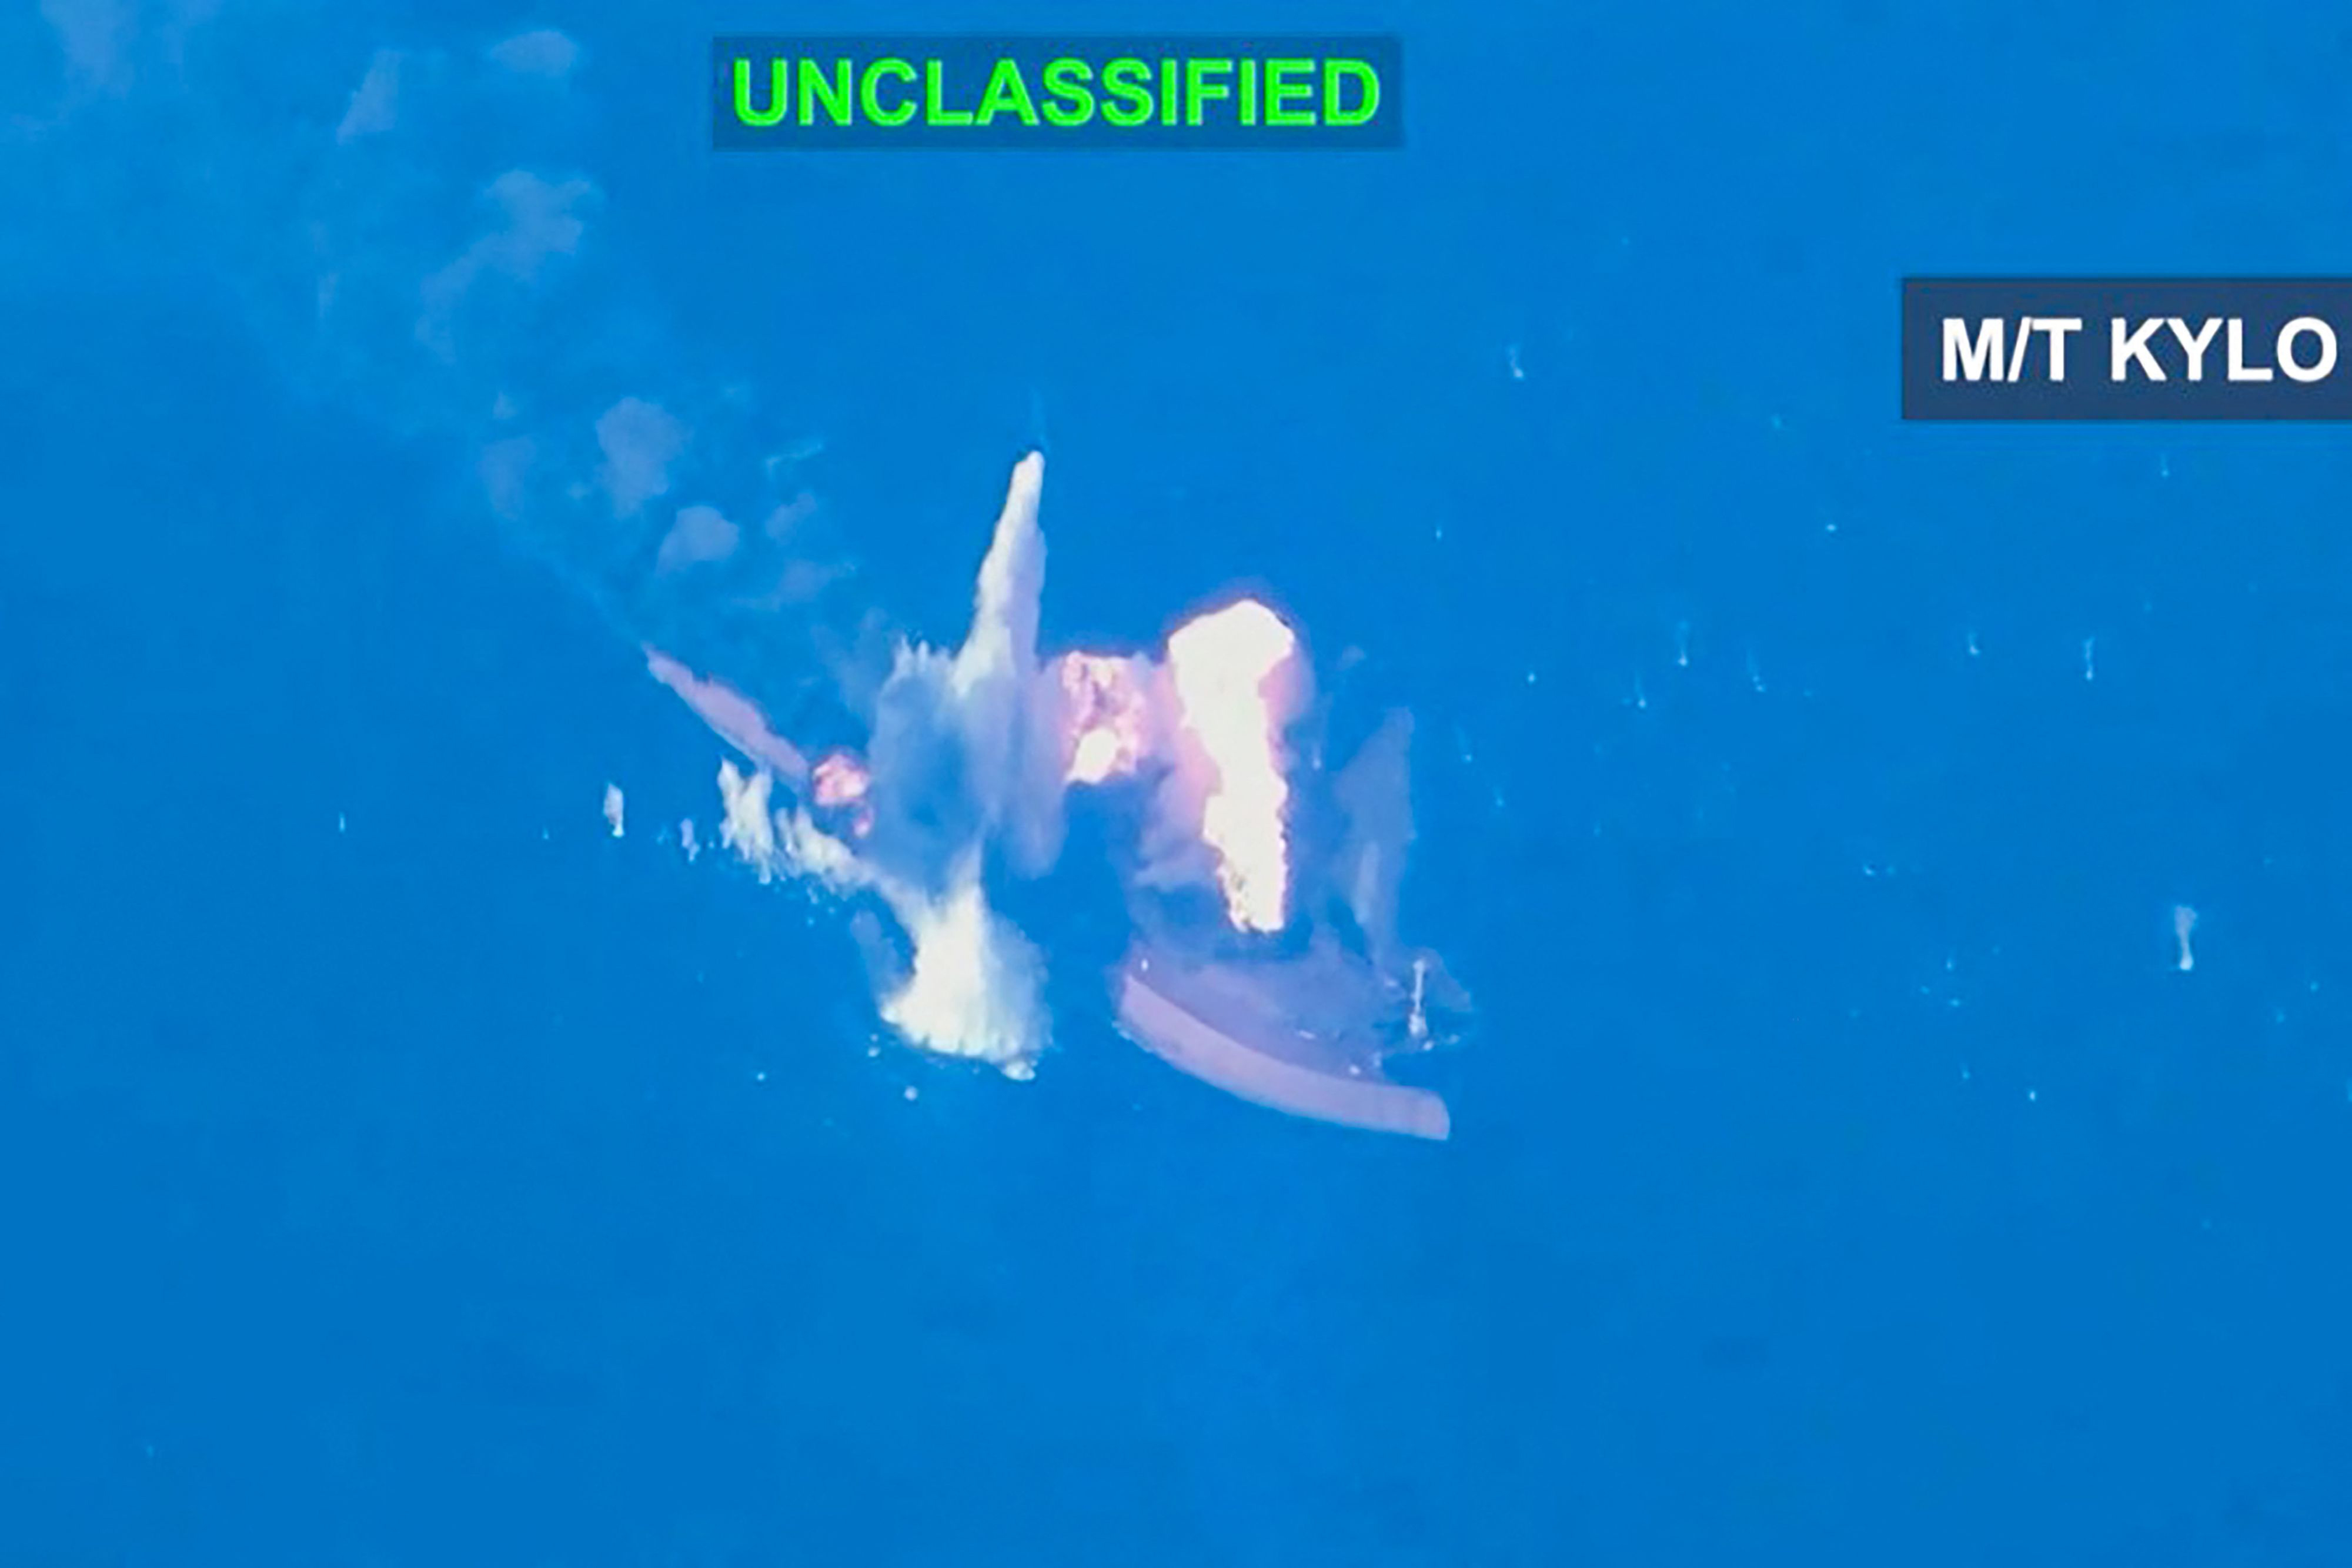
US Strikes Iranian Oil Tankers After Missile Attack

Iran Allows Government Agencies on Western Platforms, Restricts Public Access