1 hr ago
GRSE Versus Data Patterns: Growth, Margins and Valuations Compared
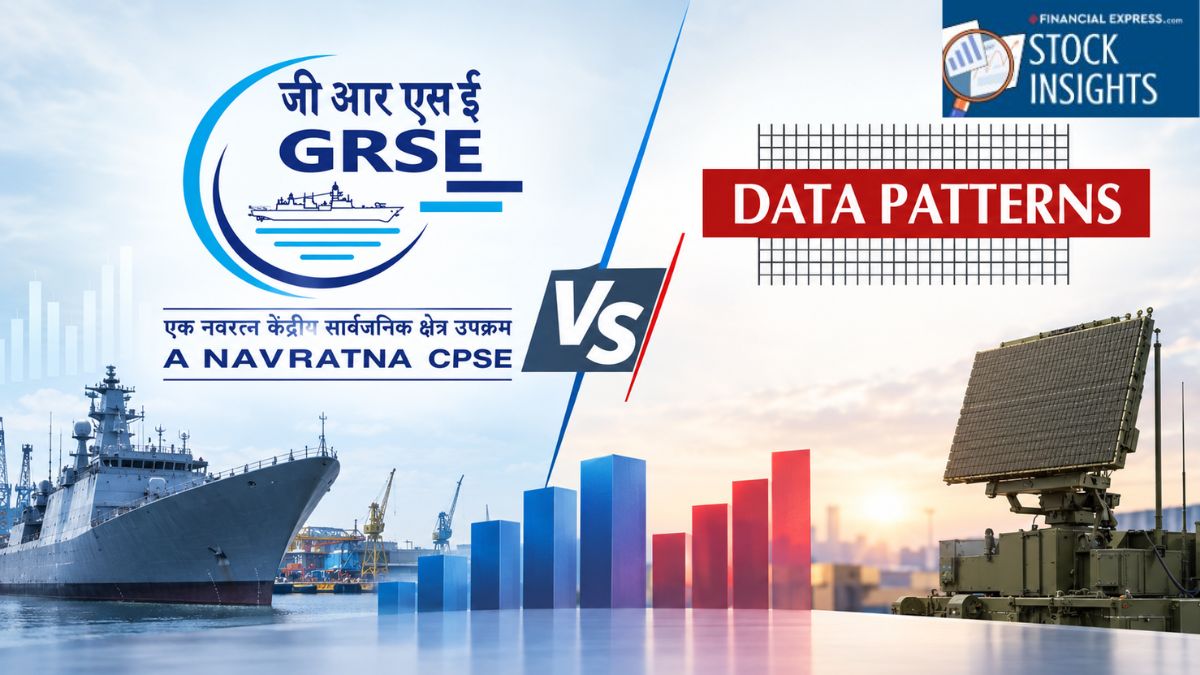
GRSE and Data Patterns are two Indian defence companies, but they make different things.
GRSE builds and repairs warships for the Indian Navy and Coast Guard.
Data Patterns makes electronic systems used in aircraft, ships, space equipment and other defence platforms.
GRSE grew its sales faster from FY22 to FY26.
Data Patterns earned much more profit from each rupee of sales because its margins were higher.
GRSE’s returns on capital and shareholders’ money improved strongly by FY26.
Both companies had very little debt, but their cash flows changed significantly from year to year.
GRSE also had a much larger order book, while Data Patterns traded at more expensive valuation multiples.
Future results will depend on executing orders, developing products, expanding capacity and collecting cash.

GRSE’s revenue grew at a 41.34% FY22–FY26 CAGR, compared with 31.32% for Data Patterns.
Data Patterns reported a FY26 EBITDA margin of 40.11%, well above GRSE’s 10.40%.
GRSE’s FY26 ROCE and ROE reached 38.45% and 31.79%, while Data Patterns recorded 21% and 17%.
Both companies maintained very low debt, but operating cash flow was volatile for each during FY22–FY26.
As of September 24, 2026, GRSE traded at lower valuation multiples than Data Patterns, including P/E of 41.4x versus 91.2x.
- Who
- Garden Reach Shipbuilders & Engineers (GRSE) and Data Patterns (India) Ltd.
- What
- A comparison of their business models, growth, profitability, balance sheets, cash flows, recent performance and valuations.
- Where
- India, with both companies primarily serving the Indian defence market and Data Patterns pursuing overseas opportunities.
- When
- The comparison covers FY22–FY26, Q1 FY27 and market data dated September 24, 2026.
- Why
- To assess which company has stronger fundamentals, considering growth, margins, returns, leverage, cash conversion, order visibility and valuation.
Case for GRSE
Case for Data Patterns
Growth and order visibility
Case for GRSE
GRSE delivered faster FY22–FY26 revenue growth, with a 41.34% CAGR, and had a Q1 FY27 order book of Rs 135,962.6 million, about 95% of which was shipbuilding.
Case for Data Patterns
Data Patterns grew revenue at a 31.32% FY22–FY26 CAGR and is expanding its pipeline, including negotiated contracts and July orders, to around Rs 26,540 million.
Profitability
Case for GRSE
GRSE’s EBITDA CAGR was 62.32% from FY22 to FY26, and its EBITDA margin improved from 6% to 10.4%.
Case for Data Patterns
Data Patterns maintained substantially higher margins, with FY26 EBITDA margin of 40.11% and gross margin of 63.24%, reflecting its electronics and proprietary engineering focus.
Returns and valuation
Case for GRSE
GRSE’s FY26 ROCE of 38.45% and ROE of 31.79% were higher than Data Patterns’ 21% and 17%; it also traded at lower P/E, P/B and EV/EBITDA multiples.
Case for Data Patterns
Data Patterns’ higher valuation reflects a technology-focused, high-margin business, though its Q1 FY27 EBITDA fell 2.2% and PAT fell 13.2% year over year.
Key facts
- GRSE FY26 revenue
- Rs 70,021.6 million; FY22–FY26 CAGR of 41.34%
- Data Patterns FY26 revenue
- Rs 9,250 million; FY22–FY26 CAGR of 31.32%
- FY26 EBITDA margin
- GRSE: 10.40%; Data Patterns: 40.11%
- Q1 FY27 order book
- GRSE: Rs 135,962.6 million; Data Patterns: Rs 9,200 million
- FY26 leverage
- GRSE debt/equity: 0.012x; Data Patterns debt/equity: zero reported debt
- Market valuation
- GRSE P/E: 41.4x; Data Patterns P/E: 91.2x, based on September 24, 2026 data
- FY27 outlook
- Data Patterns expects 20–25% revenue growth and 35–40% EBITDA margins
Sources
Related news

GRSE, Cochin Shipyard Dividend Comparison Ahead of Record Date

Two Low-Debt SME Stocks Linked to India’s Maritime Push

Indian Shipyard Stocks Fall as Order Books Diverge

Mazagon Dock Plans Commercial Shipbuilding Expansion Amid Order-Book Concerns
Defense Capex Surge Boosts Bharat Electronics, Data Patterns Stocks

Four Infrastructure-Linked SMEs Show Growth Amid India’s CapEx Boom

Coastal Security Exercise Tests Readiness Across Maharashtra, Goa

Indian Navy Plans Record 18-Warship Expansion In 2026

INS Trishul Joins India-France Varuna Naval Exercise in France

Naval Commanders Urged to Strengthen Combat Readiness and Coordination