

2 hrs ago
HDFC Bank Shares Seek Recovery Despite Bearish Technical Trend
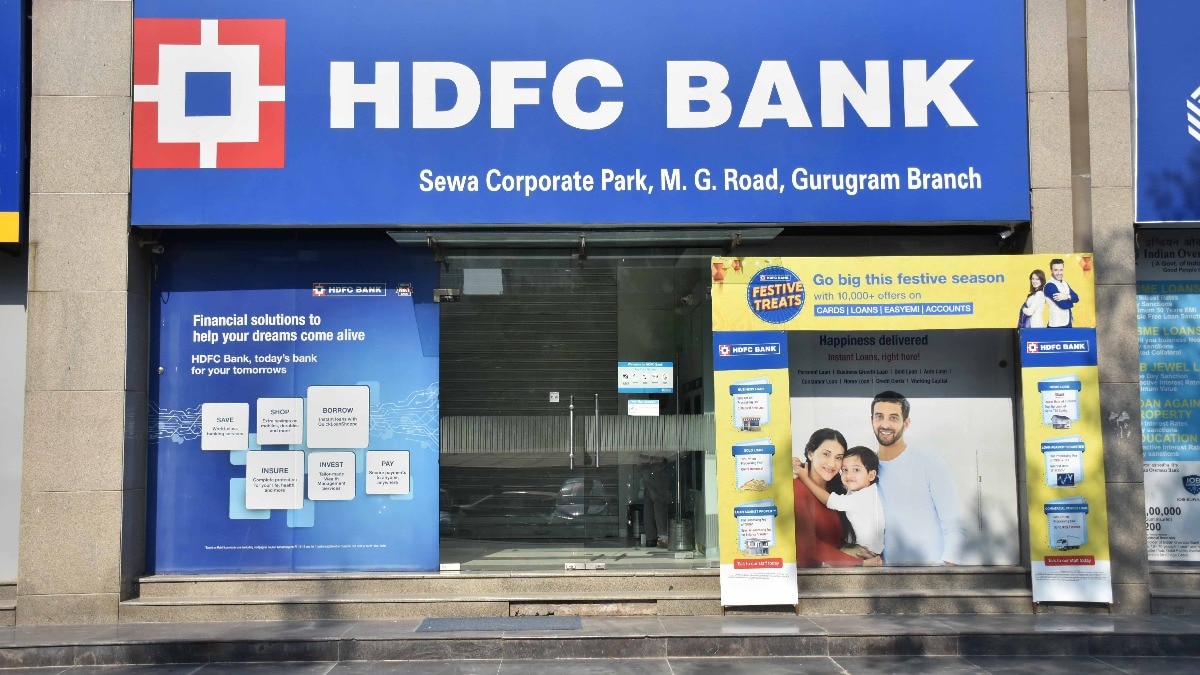
HDFC Bank’s share price has recently moved up from a low support area.
However, an analyst says the stock still shows signs of weakness.
The price has been making lower highs and lower lows.
The analyst sees resistance around Rs 720–725 and Rs 745–750.
Prices above Rs 725 could signal a stronger recovery.
A fall below Rs 680 could lead to more declines.
The bank’s profit increased by 12% in the first quarter of FY26.
But its gross and net bad-loan ratios were higher than in some earlier periods.

HDFC Bank shares recently rebounded from the Rs 680–685 support zone.
Analyst Shitij Gandhi described the stock’s broader technical trend as strongly bearish.
Resistance is seen near Rs 720–725, with a stronger hurdle at Rs 745–750.
A break above Rs 725 could support recovery, while a fall below Rs 680 may extend declines.
Standalone net profit rose 12% year-on-year to Rs 18,155 crore in Q1 FY26, while gross and net NPAs increased.
- Who
- HDFC Bank and Shitij Gandhi, AVP–Equity Technical Research at SMC Global Securities.
- What
- HDFC Bank shares are attempting to recover from recent lows while remaining in a broader bearish technical trend.
- Where
- When
- The analysis covers the recent share-price movement and Q1 FY26 results, including the June quarter.
- Why
- The rebound followed buying interest near the Rs 680–685 support zone, although the stock remains below key moving averages.
Bearish Technical View
Recovery Case
Overall trend
Bearish Technical View
The stock is forming lower highs and lower lows within a descending channel, with price action below key moving averages.
Recovery Case
The rebound from the Rs 680–685 support zone indicates some buying interest and could develop into a recovery.
Important price levels
Bearish Technical View
A breach of Rs 680 could extend the decline, while Rs 700 is the immediate support level.
Recovery Case
A decisive breakout above Rs 725 could trigger a recovery toward the higher resistance area.
Fundamental performance
Bearish Technical View
Gross and net NPA ratios increased compared with June 2024, indicating weaker asset-quality metrics in the reported comparisons.
Recovery Case
Standalone net profit rose 12% year-on-year to Rs 18,155 crore, and five-year net-profit CAGR was 21%.
Key facts
- Q1 FY26 net profit
- Rs 18,155 crore
- Year-on-year profit growth
- 12%, compared with Rs 16,175 crore in Q1 FY25
- Five-year net-profit CAGR
- 21%
- Gross NPA ratio
- 1.40% in the June quarter, versus 1.33% in June 2024
- Net NPA ratio
- 0.47% in the last quarter, versus 0.39% in June 2024 and 0.43% in March 2025
- Immediate technical support
- Rs 700, followed by Rs 680–685
- Technical resistance
- Rs 720–725 initially, followed by Rs 745–750
Quotes
Shitij Gandhi
AVP - Equity Technical Research at SMC Global Securities
“A decisive breakout above Rs 725 could trigger recovery, while a breach of Rs 680 may extend the decline.”
 businesstoday.in
Sources
Related news
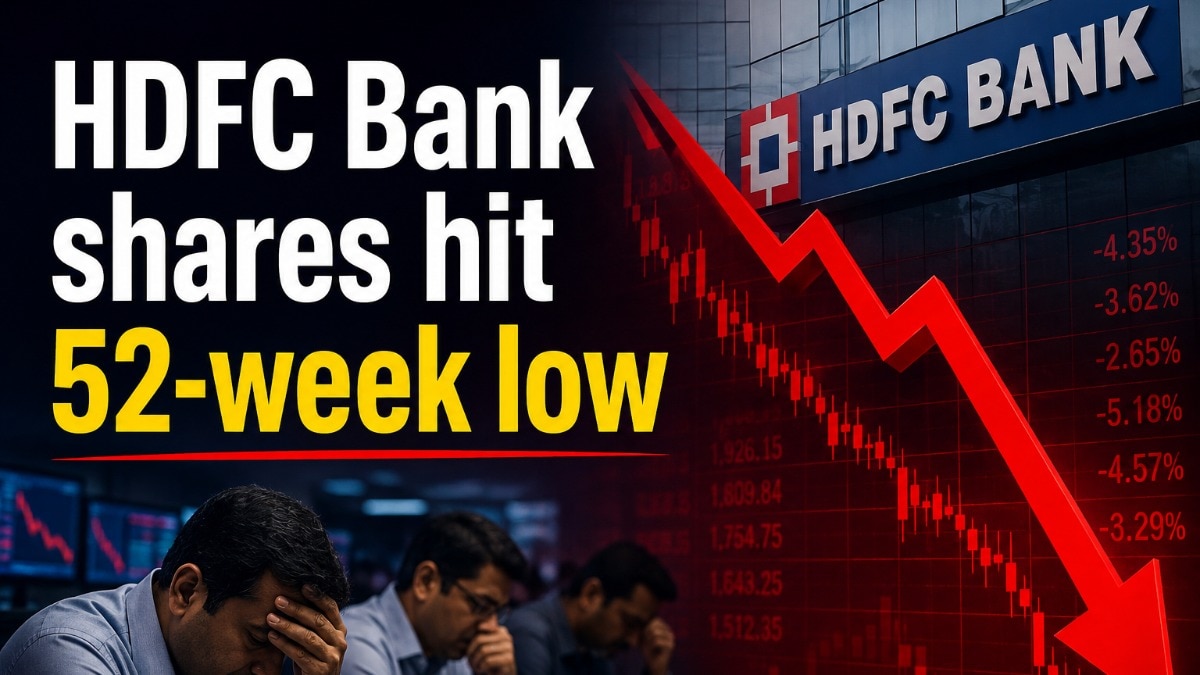
HDFC Bank Shares Fall Below Rs 700, Brokerages Set Targets
HDFC Bank Shares Hit 52-Week Low as Experts See Downside

HDFC Bank shares rise after $1.75 billion bond fundraising
HDFC Bank Underperforms in 2026, Analysts See Upside

HDFC Bank Shares Flat Amid Carlisle Investors Report

NSDL, CDSL and BSE: Key Technical Levels to Watch
Rate-Sensitive Shares Slide as October RBI Hike Bets Rise

Personal Loan Rates Start at 8.90% Across Eight Banks

Solar, BEL and CG Power Shares Slide Amid Market Sell-Off
Indian Markets Rise as IT Stocks, HDFC Bank Rally
