

Archive · 3 Oct 2026
Gold or S&P 500? Returns Depend on When You Invest
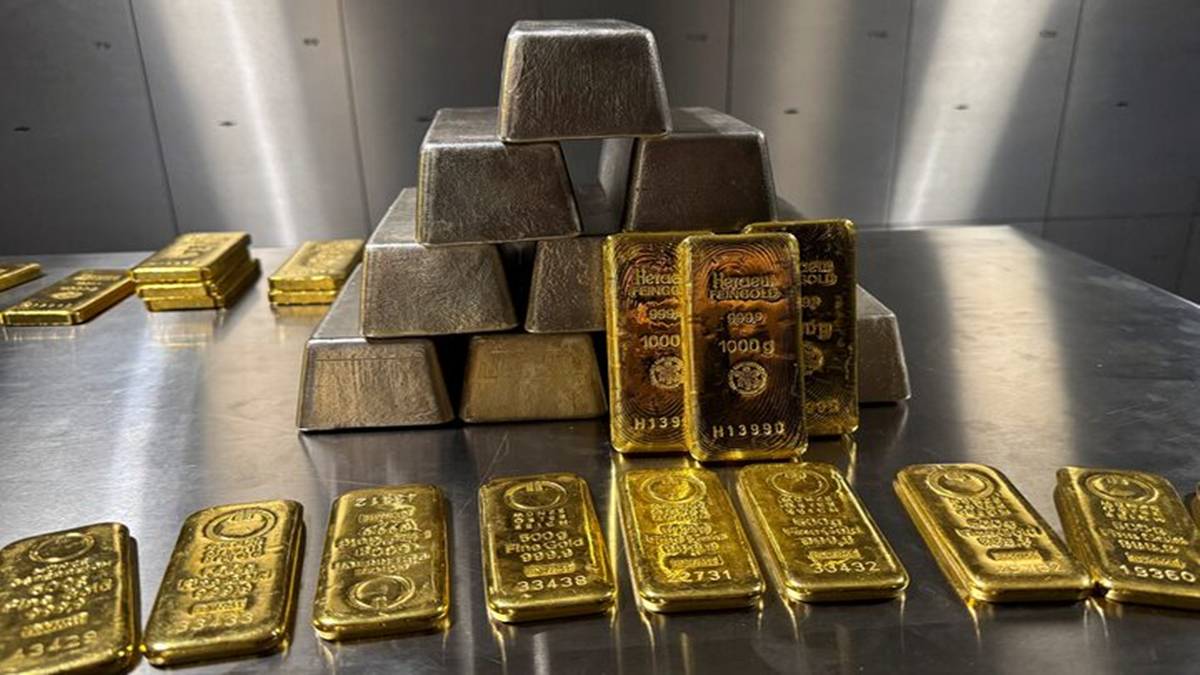
Gold and the S&P 500 are two different ways people invest.
The S&P 500 represents a group of large US companies, while gold is a precious metal.
Looking from 2000 to 2026, the S&P 500 earned more on average each year, including dividends.
But gold did better during some periods, especially from 2000 to 2010 and from October 2023 to October 2026.
Stocks did better in other periods, including 2010 to 2020.
People may turn to gold when they feel worried about the economy or world events.
Unlike stocks, gold does not pay dividends or other income.
The article says investors might use both, because each can play a different role.
Returns for Indian investors can differ because of currency changes, duties, and taxes.

From 2000 to 2026, the S&P 500 returned an average 10.1% annually, including reinvested dividends, compared with gold’s 8.2%.
Gold outperformed the S&P 500 from 2000 to 2010, while the S&P 500 led from 2010 to 2020 and from 2020 to 2026.
Between October 2023 and October 2026, gold gained 28%, compared with 21% for the S&P 500, in US dollar terms.
The S&P 500-to-gold ratio rises when equities outperform gold and falls when gold outperforms equities; it was about 1.83 in October 2026.
Gold can act as a hedge in uncertain periods but pays no income, while S&P 500 companies provide dividends; neither asset is a permanent winner.
- Who
- Investors comparing gold with the S&P 500, including Indian investors.
- What
- A comparison of their returns across different periods and how the assets may serve different roles in a portfolio.
- When
- The performance review covers 2000 to October 2026, with period comparisons for 2000–2010, 2010–2020, and 2020–2026.
- Where
- Returns are presented in US dollars, using international gold prices and the US S&P 500 index; the article also discusses implications for Indian investors.
- Why
- To show how each asset has performed over different periods and why there is no permanent winner.
- Long-term annualized returns, 2000–2026
- S&P 500: approximately 10.1%, including reinvested dividends; gold: approximately 8.2%.
- Returns, 2000–2010
- Gold: 12.8% CAGR; S&P 500: -0.9% CAGR.
- Returns, 2010–2020
- Gold: 1.5% CAGR; S&P 500: 13.9% CAGR.
- Returns, 2020–2026
- Gold: 9.3% CAGR; S&P 500: 11.2% CAGR.
- October 2023–October 2026
- Gold gained 28% and the S&P 500 gained 21%, in US dollar terms.
- S&P 500-to-gold ratio
- About 1.83 in October 2026; the article gives a historical long-term average range of approximately 1.14 to 2.0.
- Income and Indian returns
- The S&P 500 dividend yield is described as around 1.5%, while gold generates no income. Indian gold returns may differ due to currency movements, import duties, and taxes.